Diagnosing Concept Drift with Visual Analytics
Weikai Yang1
Zhen Li1
Mengchen Liu2
Yafeng Lu3
Kelei Cao1
Ross Maciejewski4
Shixia Liu1
1Tsinghua University
2Microsoft
3Bloomberg L.P.
4Arizona State University

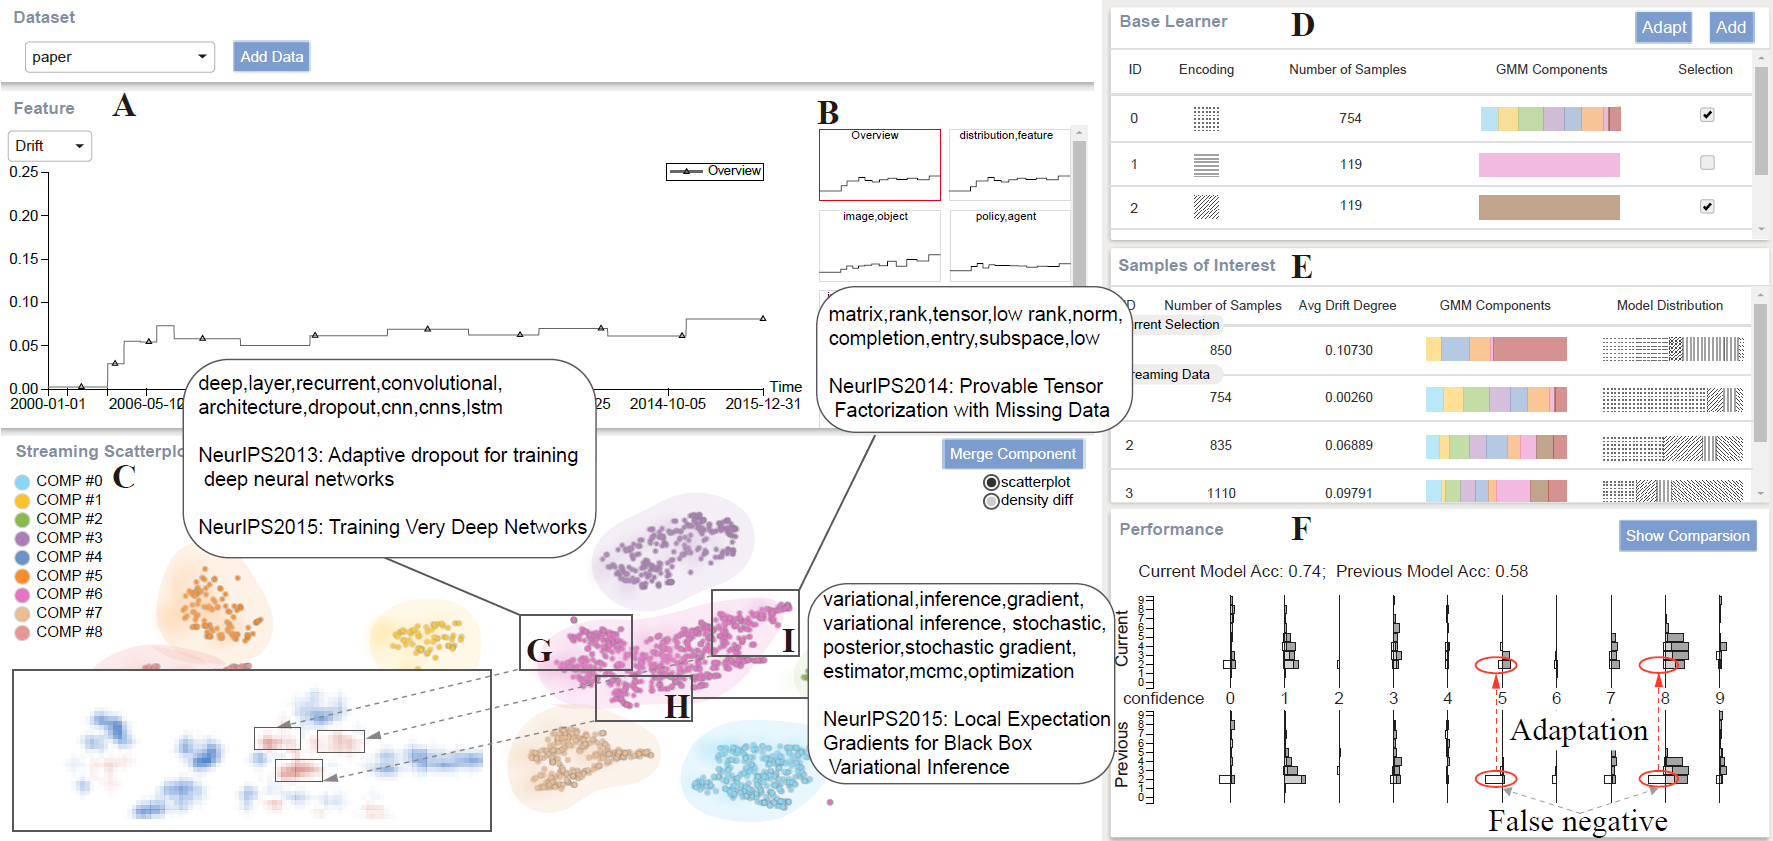
Concept drift is a phenomenon in which the distribution of a data stream changes over time in unforeseen ways, causing prediction models built on historical data to become inaccurate. While a variety of automated methods have been developed to identify when concept drift occurs, there is limited support for analysts who need to understand and correct their models when drift is detected. In this paper, we present a visual analytics method, DriftVis, to support model builders and analysts in the identification and correction of concept drift in streaming data. DriftVis combines a distribution-based drift detection method with a streaming scatterplot to support the analysis of drift caused by the distribution changes of data streams and to explore the impact of these changes on the model’s accuracy. A quantitative experiment and two case studies on weather prediction and text classification have been conducted to demonstrate our proposed tool and illustrate how visual analytics can be used to support the detection, examination, and correction of concept drift.